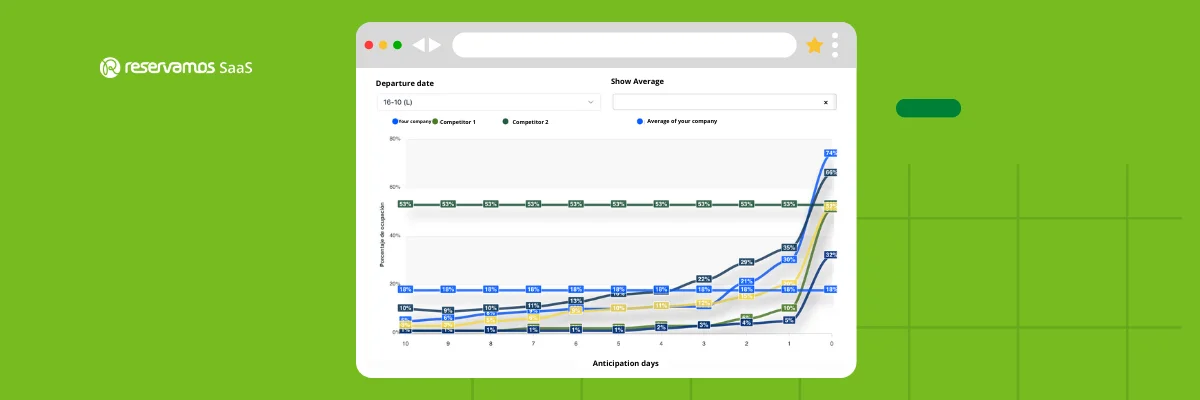
With the Competitor Monitor, you can now track occupancy in advance.
The Competitor Monitor is one of our partners’ most valuable tools for observing and analyzing market behavior, enabling them to develop differentiated strategies to enhance their competitiveness.
Through the Competitor Monitor, we make tracking the performance of your routes and schedules within your market easier. This helps you create Revenue Management strategies to boost your company’s occupancy rates and revenue.
Given the importance of this module, which is part of our Revenue Management System, our product and development teams continually introduce updates to enhance the user experience and usability of this digital tool. This ensures that your operational teams can always access agile and efficient technology to optimize their market monitoring processes.
For instance, a few months ago, we introduced the Occupancy Trend chart, which shows how occupancy rates have changed from the observation day to 10 days prior.
Now, in addition to having a chart that displays this information, the development team has also added the Occupancy by Days of Anticipation chart. This feature allows you to forecast occupancy trends for the next 10 days for each route and schedule registered in the Competitor Monitor as the departure date approaches.
With this metric, your operations team can more easily track the profitability of each trip and develop strategies to drive more sales, ensuring optimal occupancy for each route and schedule.
The Competitor Monitor is your operational team’s essential tool to gain a more strategic perspective, anticipate market trends, and increase revenue.
Market Occupancy Percentage in the Competitor Monitor
An important metric integrated into the Competitor Monitor’s data is the occupancy percentage by competitor. This gives bus company operations teams valuable insights directly within the platform
The occupancy percentage chart offers the following benefits:
- Easier visualization of competitor occupancy within the selected timeframe.
- Quick identification of when a competitor’s occupancy exceeds your own.
- Identification of the competition’s supply directly linked to their occupancy.
The Competitor Monitor is the only tool available that offers bus companies both price tracking and occupancy data. This unique combination enables companies to analyze the supply and demand of each competitor individually. By providing valuable insights, we empower bus companies to enhance their digital growth. If you’d like to learn more about the Competitor Monitor, send us an email, and we’ll be happy to schedule a free demo.

