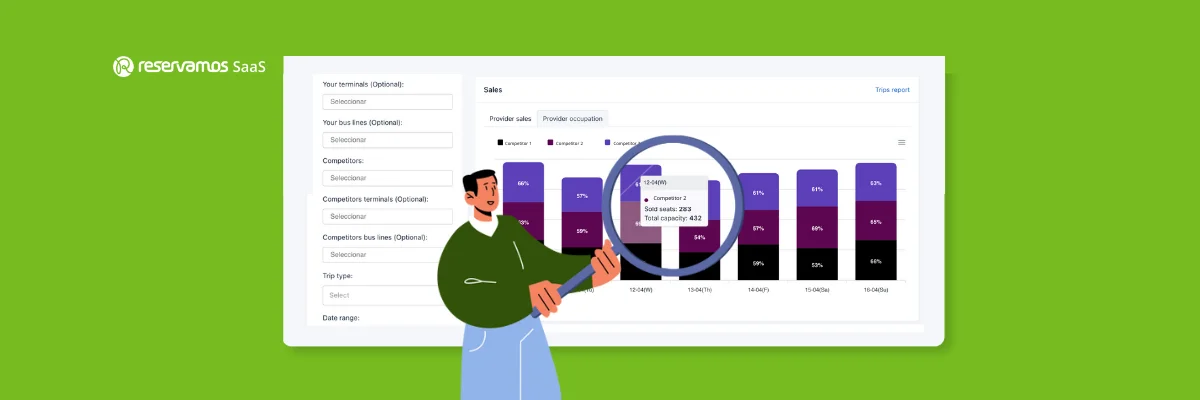
We have integrated the market occupancy percentage into the Competitor Monitor to provide you with a more accurate analysis.
The constant use of our digital ecosystem by our allies in Reservamos SaaS has enabled a constant improvement of our solutions to be more precise and tailored to the needs of bus companies.
The Competitor Monitor, one of the modules of BrainPROS, our Revenue Management solution, has proven to be a very useful tool for bus companies to access data that answers key questions about their market; and from there, generate more accurate strategies that help increase their revenue.
An important piece of data integrated into the information displayed by the Competitor Monitor is the competitor occupancy percentage. This helps the operational teams of bus companies provide relevant information, without the need to take extra steps outside the solution.
The new occupancy percentage graph provides the following benefits:
- More agile visualization of the competition’s occupancy during a specified period.
- The bus company can quickly identify when a competitor has higher occupancy.
- Identify the competition’s offerings that are directly related to their occupancy.
The Competitor Monitor is the only tool on the market that currently provides bus companies with not only price tracking but also occupancy, to visualize the supply vs. demand of each individual competitor. In this way, we bring relevant data that can help bus companies continue to drive their digital growth.
If you want to learn more about the Competitor Monitor, please schedule a free demo.

